The essential guide to foot traffic data analytics
January 14, 2026
Learn how foot traffic data is collected and analysed, the metrics that matter, and the best ways to use these mobility insights.
What is foot traffic data?
Foot traffic data (sometimes known as footfall or mobility data) measures real world pedestrian visitation to physical places. It can be gathered and analysed to understand how many people walk (or use a mobility aid) around a given area, when they go, where they come from and where they go afterwards, as well as how long they stay and how those patterns might change over time.
Knowing where and when people walk is important for businesses, governments, investors and more.
Modern datasets originate from a variety of sources, including anonymised mobile travel data, in-store sensors, counters, manual methods of data collection and more.
What is foot traffic data analysis?
Foot traffic analysis is the process of transforming this data into insights. These insights can be used by planners, retailers, investors and more to put a behavioural lens on people and places (revealing actions instead of opinions) and enable validation of and planning around a location, accurate benchmarking, competitive analysis and more.
Foot traffic analysis can answer questions such as:
How many visits occur at a site or in an area by hour/day/week/month?
When are peaks and troughs (seasonality, time of day or day of the week)?
How long do people stay (dwell time)?
Where do visitors come from (trade area/catchment)?
What nearby or subsequent places do they visit (cross visitation)?
These analyses support decisions in site selection, operations, marketing, urban planning and design, placemaking, tourism, traffic and transport, economic development and much more.
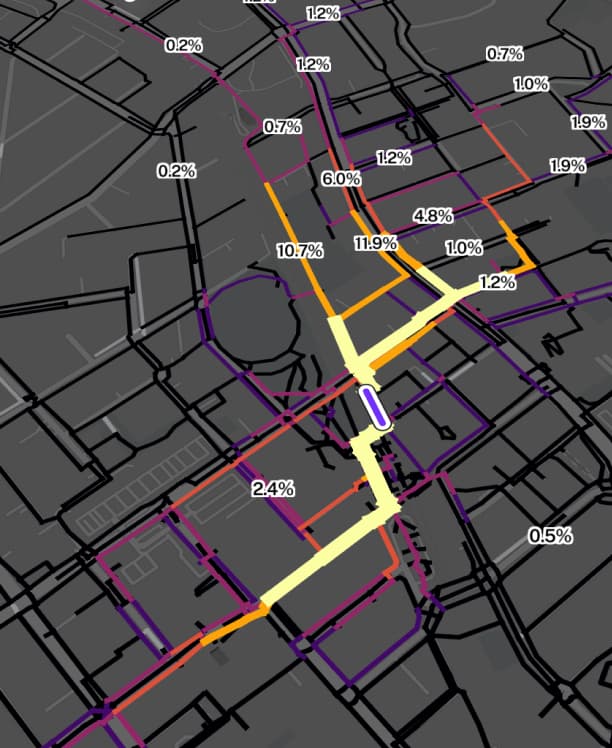
An example from Planwisely of how foot traffic data can be used to compare mobility over different days of the week.
How foot traffic data can be collected
There are multiple methods of measuring foot traffic data, each with different capabilities, potential limitations and common applications.
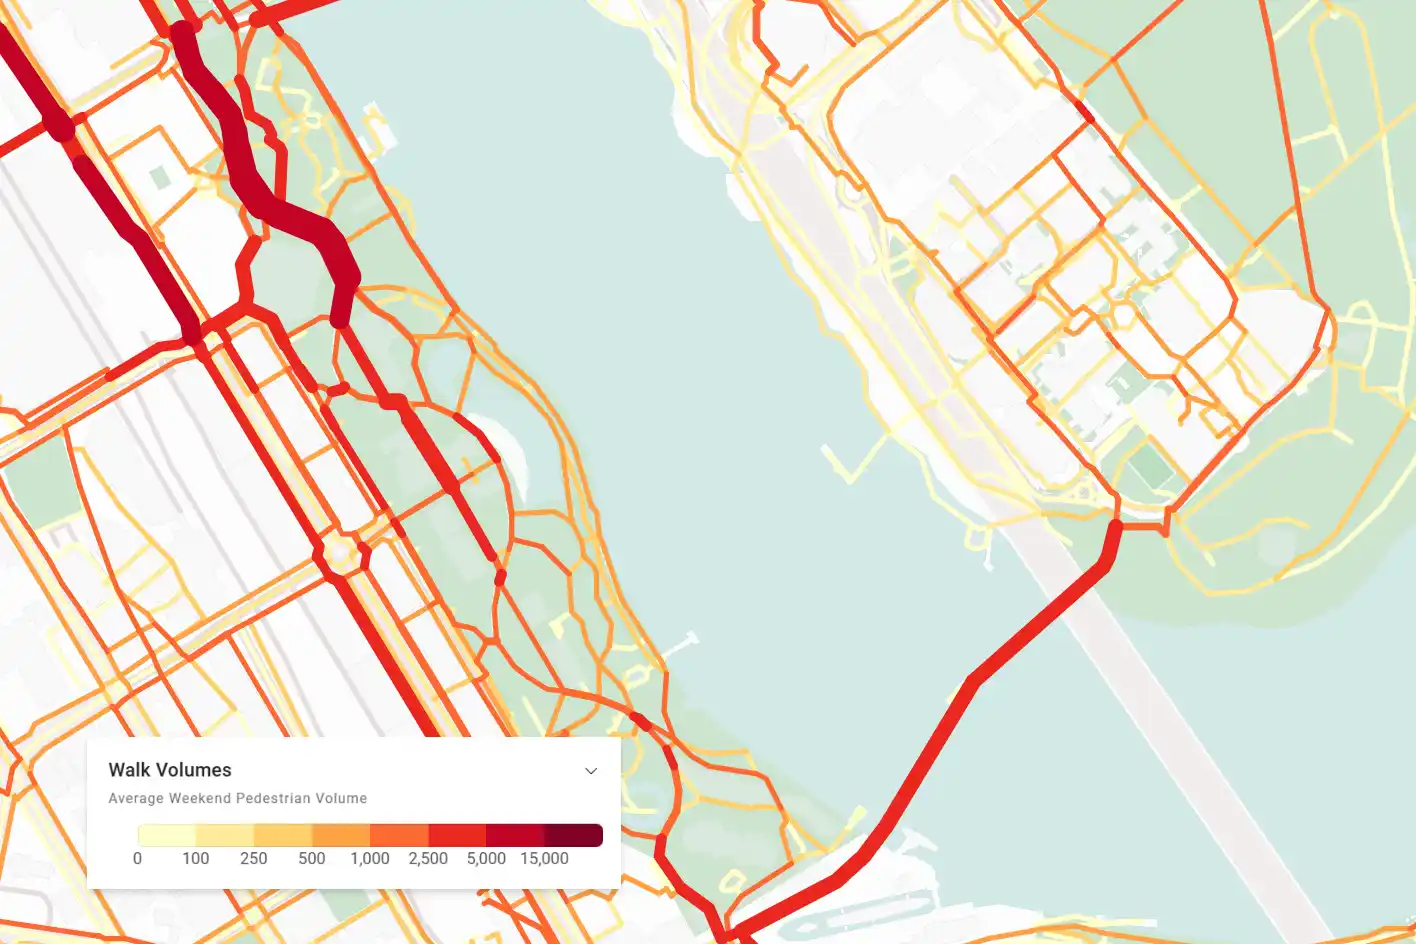
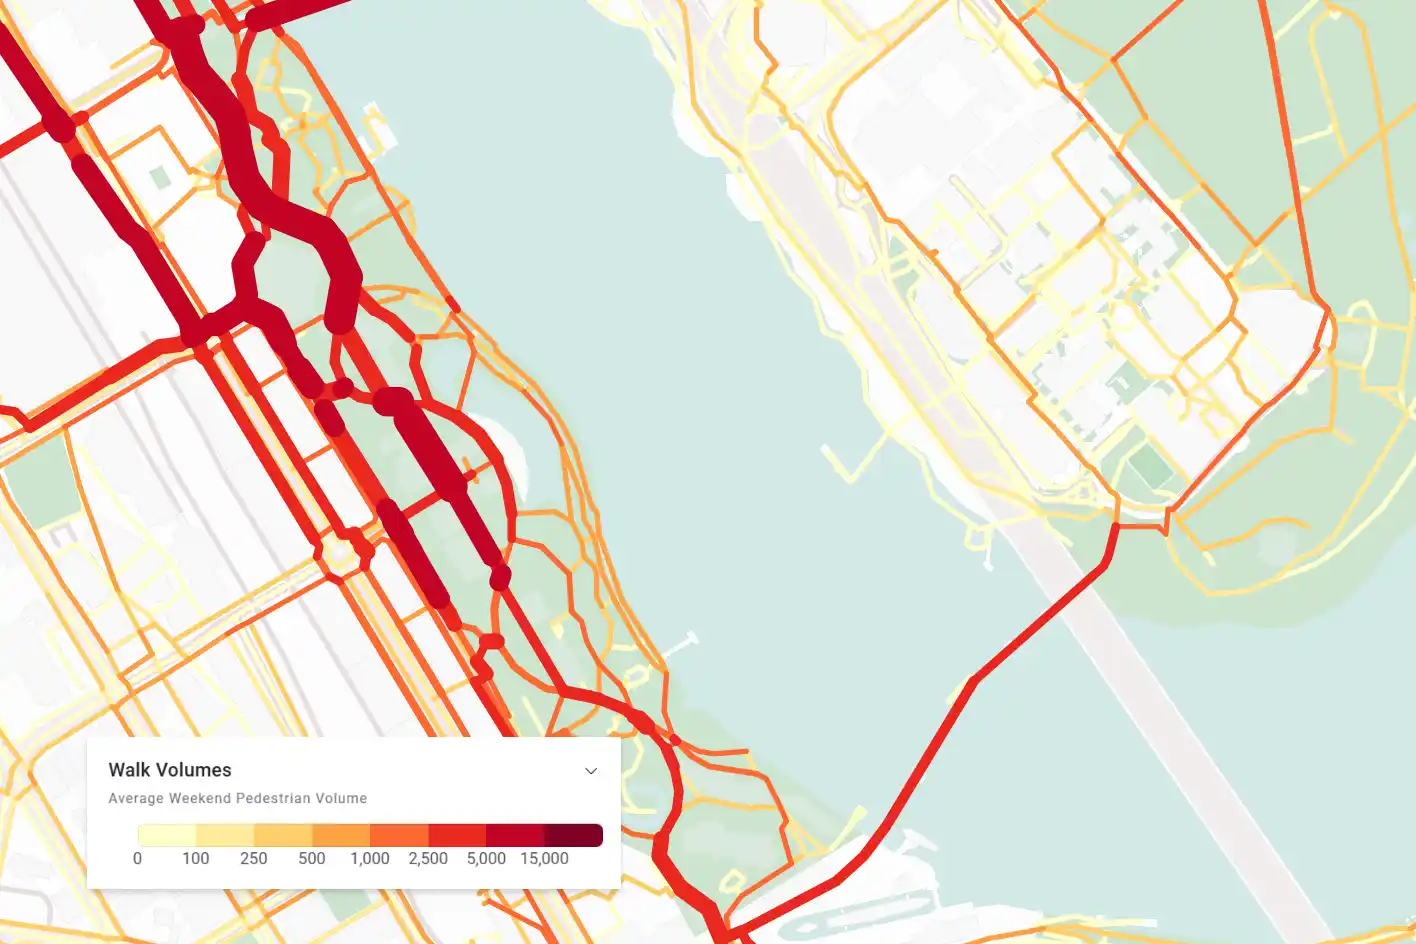
GPS mobility data: Aggregated, anonymised GPS signals (sourced from data providers) from smartphones and apps that can give analysts market wide insightsand a holistic understanding of mobility. Planwisely’s Foot Traffic Data – which has been sourced from GPS mobility data – has been rigorously tested and validated by our expert data science team to deliver street-level walk volumes for all of Australia.
Wi Fi/Bluetooth analytics: These detect other devices that enter their range to infer outside traffic, dwells, repeat visits and flows. With limited range and requiring setup to function, Wi-Fi and Bluetooth sensors are often used for operational analytics at individual locations in places like shopping centres – allowing for a narrow but impactful view of pedestrian movement and people’s behaviours around a single location.
People counters: High precision entry/exit counts and occupancy at doors, corridors, and zones for measuring movements. These counters can use a variety of technologies to function (3D, infrared and more) and are generally focused on capturing accurate measurements at specific physical entry points.
Manual counts and surveys: A potentially time and resource-intensive method that’s useful for spot checks or small studies that are limited in regard to scalability and reliability versus instrumented methods. Most often used for specific periods of time or for gathering specific datapoints, both quantitative and qualitative.
Foot traffic data can be used to extract a wide array of insights, stemming from key metrics including:
Visitation and foot traffic volume: The number of visits within a POI boundary and time window, which are essential metrics for understanding pedestrian activity at its most basic level.
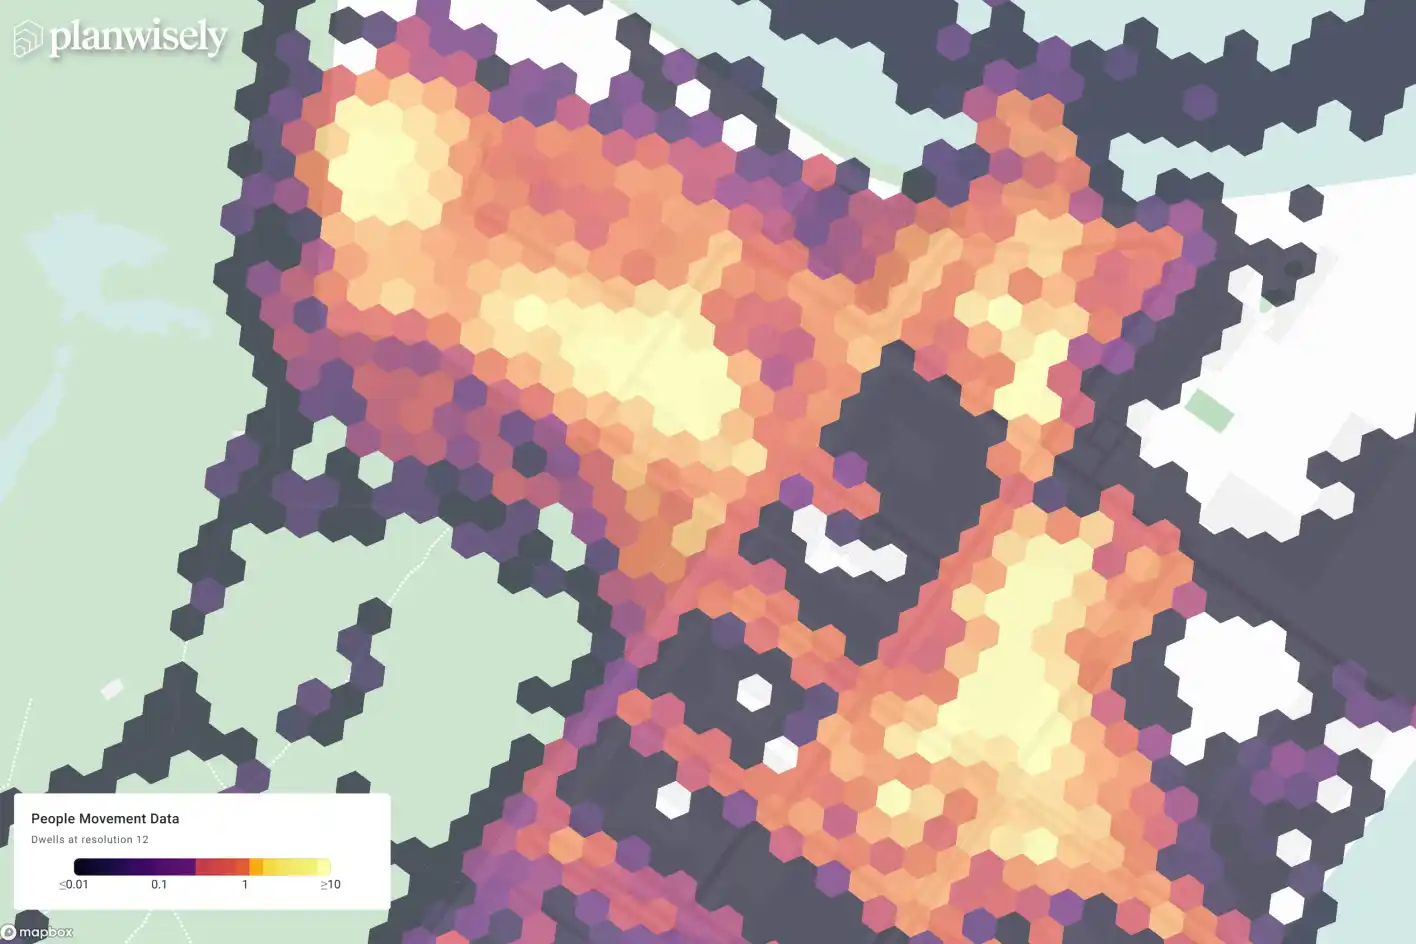
Dwell time: Estimated time a device (or visitor) remains in a particular area, helping analysts understand visitation patterns beyond pure walk volumes.
Walk catchments: These are the origin areas from which visitors travel to a site or area as a pedestrian, allowing analysts to measure walkability and accessibility to specific locations using observed mobility patterns.
Cross visitation: Overlap of visitation across brands and/or locations, which can be used to reveal complementary and competitive relationships.
Passerby vs. entrant: The amount of outside traffic detected near a storefront versus those who enter, which is particularly useful for understanding storefront conversion.
Footfall data can be gathered and analysed to uncover a range of quantitative and behavioural insights.
Applications and use cases for foot traffic data analysis
Business site selection (Retail, QSR, Services)
For businesses, footfall data can be key to driving growth by aiding in evaluating candidate sites by visit volume, passerby conversion potential, dwell patterns, competitive proximity, and catchment. It can also be used to benchmark against peers and competitors, measure campaign success, drive media buying decisions and generally help predict the sales potential of a physical space.
Foot traffic data shows how people vote with their feet, which businesses can investigate and leverage to make optimal decisions.
Urban planning and design
Urban planners and placemakers can use footfall to quantify street vitality, identify underperforming areas and subsequently guide placemaking and streetscape investments (e.g. pedestrian only zones or traffic calming methods, seating, tree canopy, lighting). This can also be used to track outcomes, measure seasonal changes and more.
Open space and recreation planning
GPS mobility data insights are a natural fit for assessing visitation to parks and playgrounds, recreation facilities, walking trails and similar assets. By analysing usage by day part and season, planners can better align amenity investment, asset maintenance and scheduling using objective patterns of movement and dwells.
Open space, parks and recreation planners can use foot traffic data to intelligently plan investments, monitor how assets are being used, who is using them and more.
Transport & access planning
Understanding and increasing mobility is more important than ever for traffic and transport planners. Foot traffic data has discursive uses in this space: performing walkability assessments; prioritising and justifying walk infrastructure; understanding and improving pedestrian access to public transport (PT); optimising PT networks and interchanges; measuring the impact of new interventions and more.
Tourism, events & venues
Knowing where people walk is highly valuable to tourism bodies, venues and event managers. Pedestrian movement insights can be used to measure attendance and dispersion, design crowd management and requisite services, demonstrate campaign impacts using uplift in visitation and dwell times and more. Tourism regions can compare movements across different locations for benchmarking, as well as measure seasonal changes and drive investment decisions based on where people walk and spend their time.
Tourism bodies can analyse place performance using dwells and foot traffic data.
How to analyse foot traffic data in Australia
Planners and other real-world decision makers can analyse street-level walk volumes and pedestrian travel patterns nationwide with Planwisely Foot Traffic Data. Using Foot Traffic Data in Planwisely’s intuitive map-based platform, you can:
Make better business and planning decisions by seeing how people vote with their feet
Discover hidden patterns of movement and visitation
Evaluate, compare and benchmark locations using targeted high-intent travel data
Get in touch with us today to learn more about the power of foot traffic data.
See how people vote with their feet with Planwisely

.webp)
.webp)


.jpg)
.webp)