
One platform. Endless real-world applications.
Extend your core Planwisely platform access with specialised add-on data products for real‑world planning and decision‑making.
Fast and intuitive map-based analytics platform
Powerful tools for unearthing insights, creating reports and more
150+ curated geospatial datasets at your fingertips
Core Platform
Powerful location data and map-based analytics - all in your web browser.
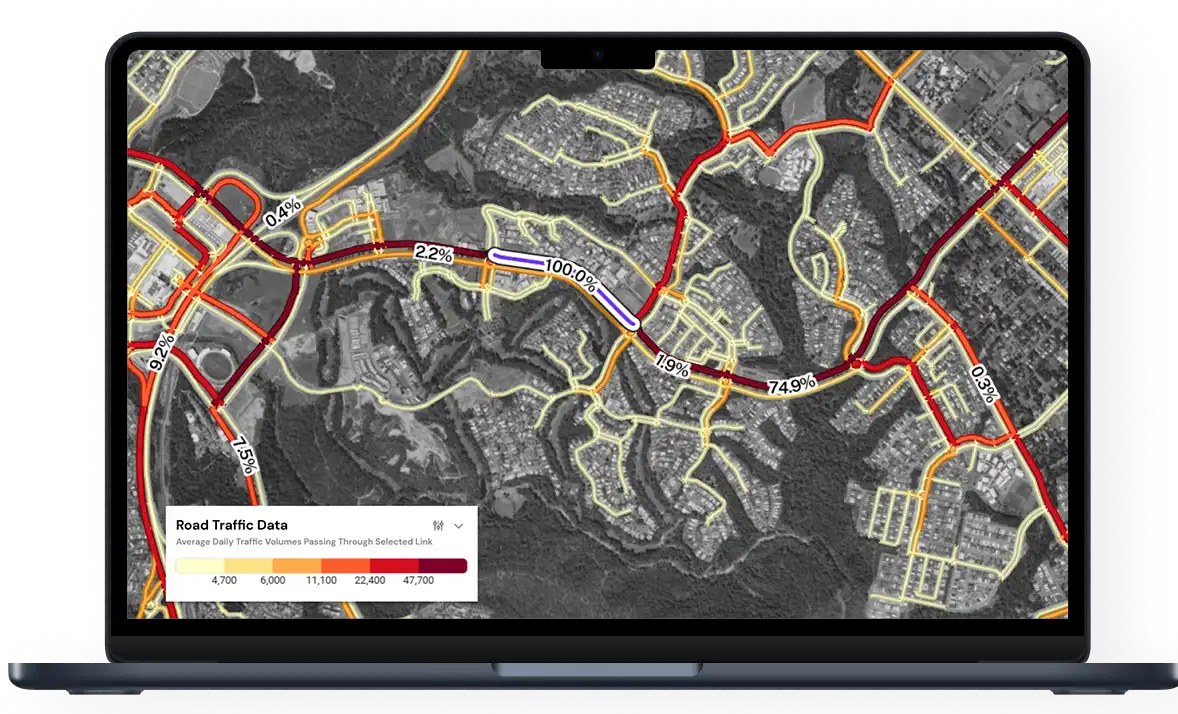


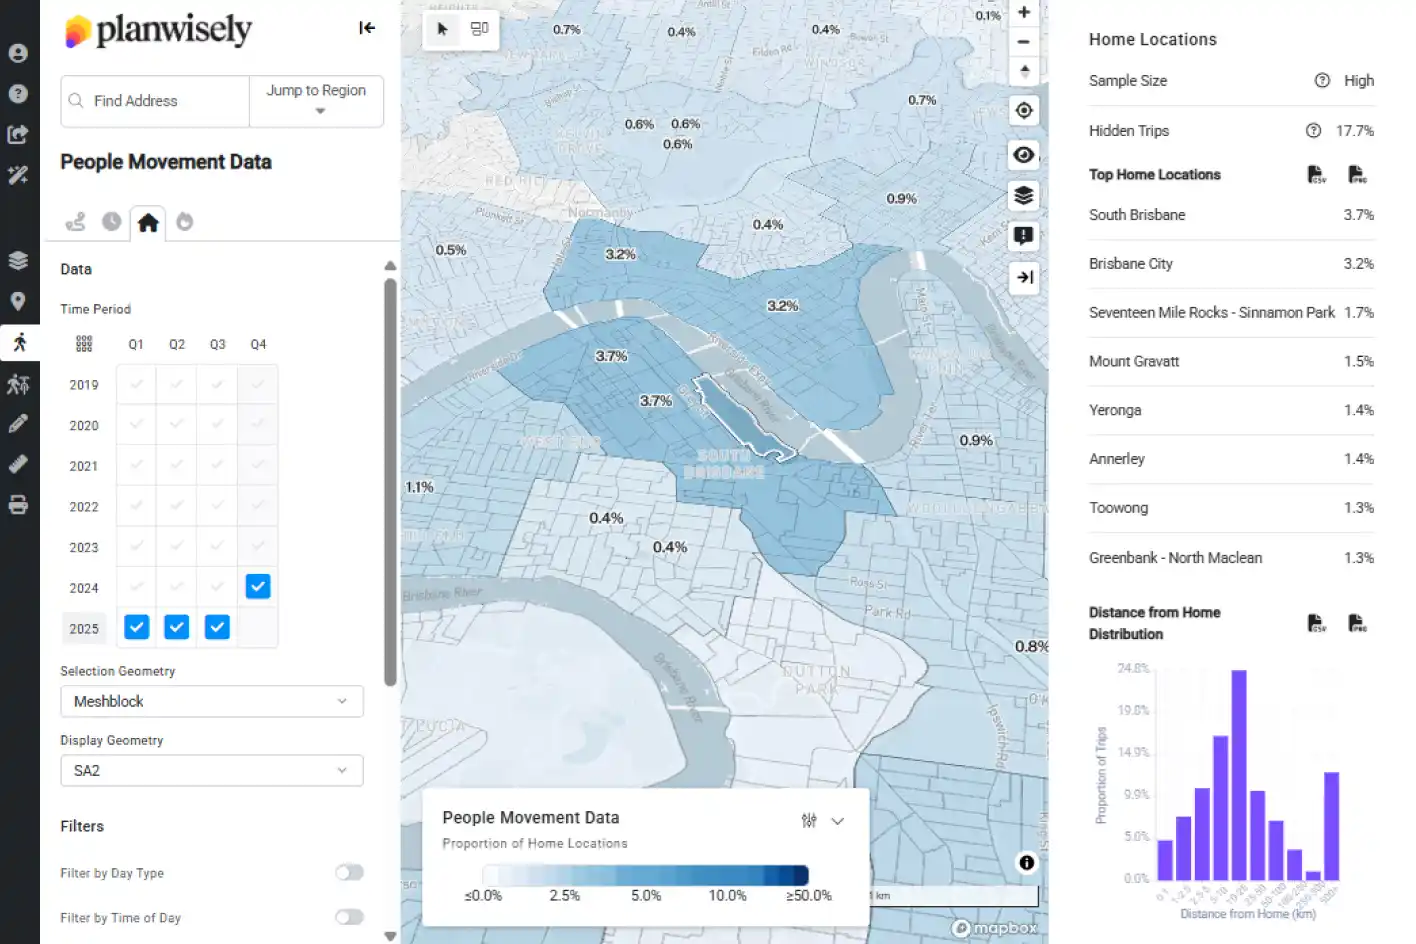
People Movement Data
Get a detailed view of how people move through cities, towns and public spaces.
Where are people travelling to and from?
Has visitation to a location changed over time?
Where do people travel through and where do they stop?
How long do people stay in a particular location?
What type of people use a place or link in the transport network?
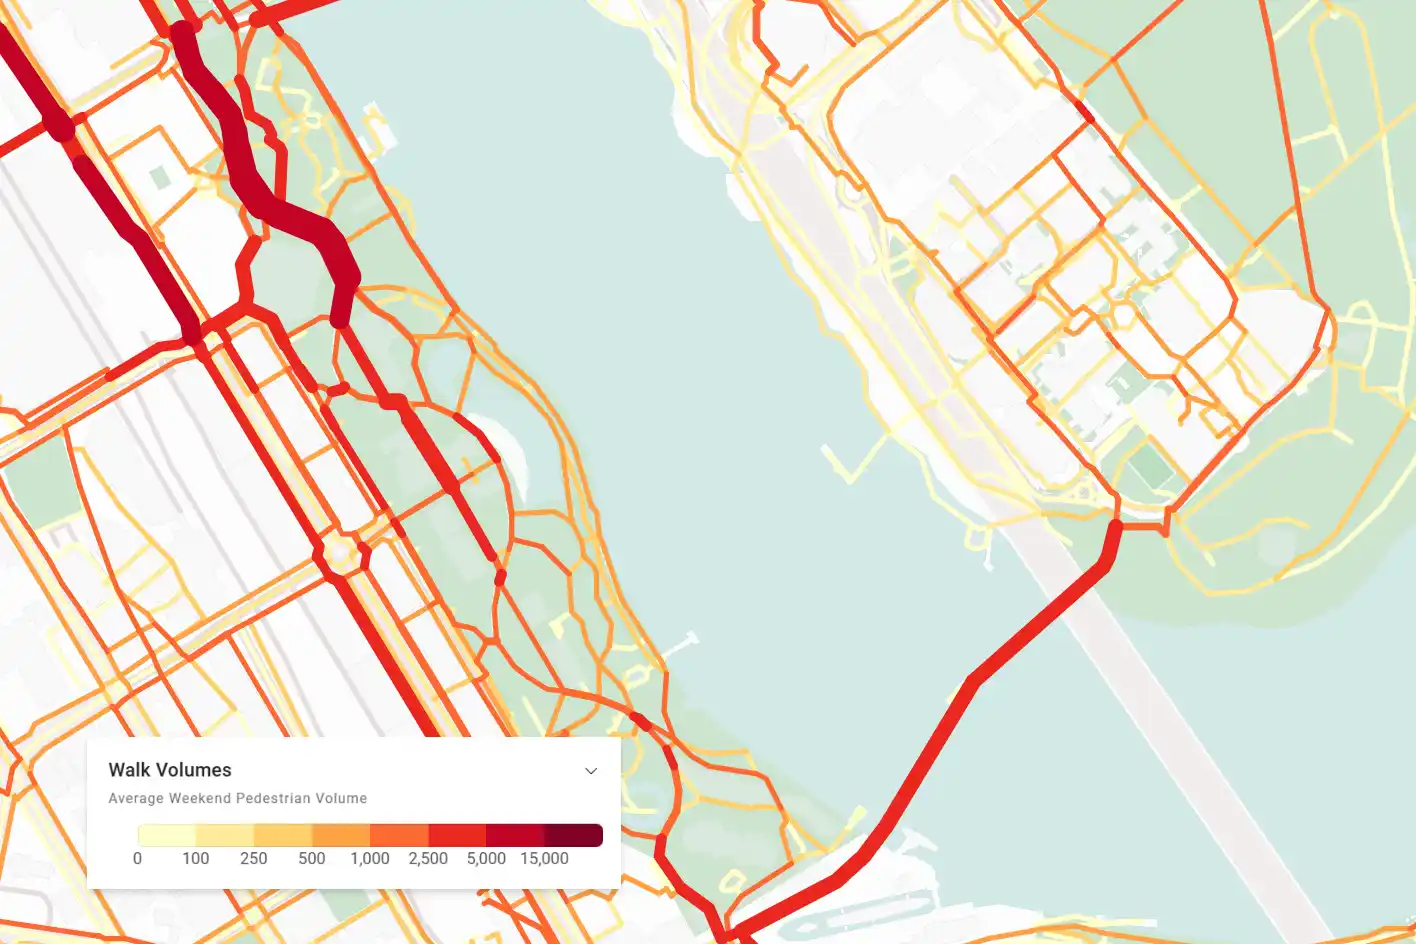
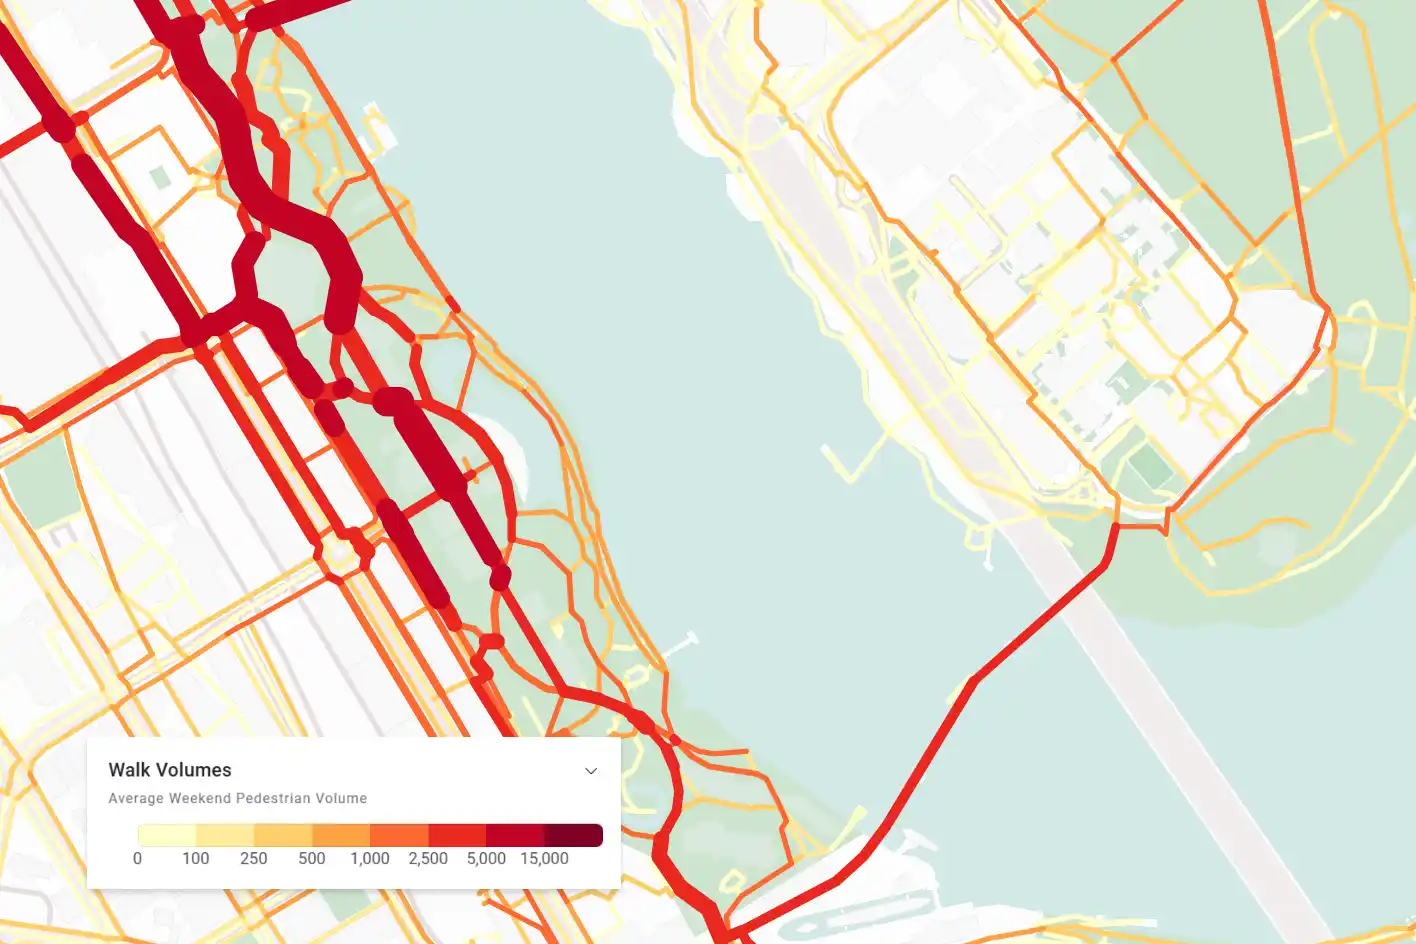
PATH Active Transport Planner
Visualise, analyse and predict walk and cycle travel patterns to understand the real benefits of active transport projects.
Analyse current walking and cycling travel patterns
Quantify the impact your project will have on future active transport trips
Support projects with evidence-based modelling results
Understand how walkable or cyclable locations are in granular detail
Built by Australia’s leading travel modelling business


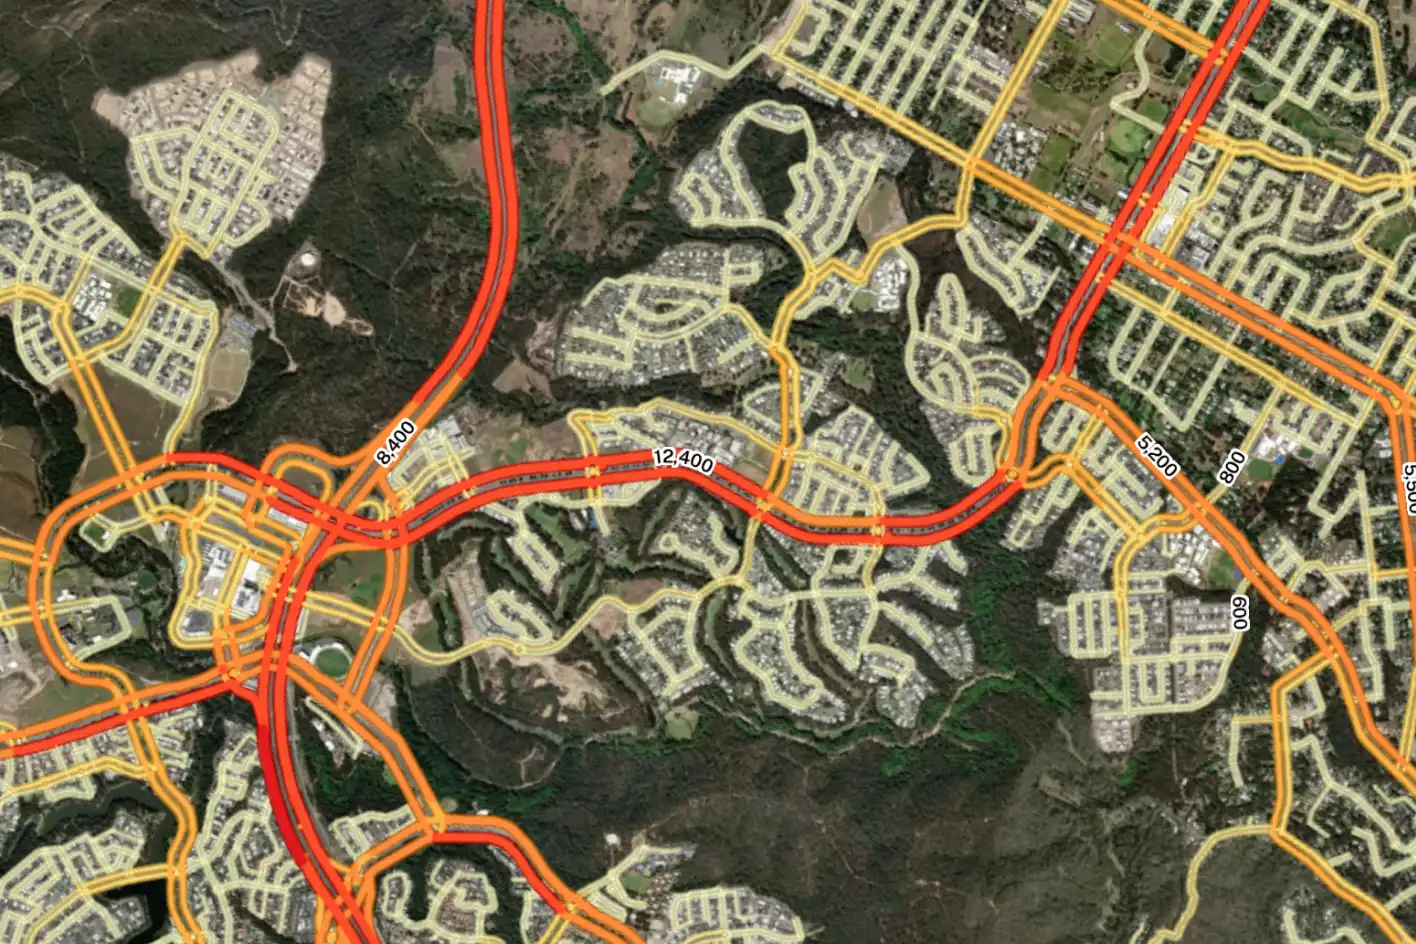
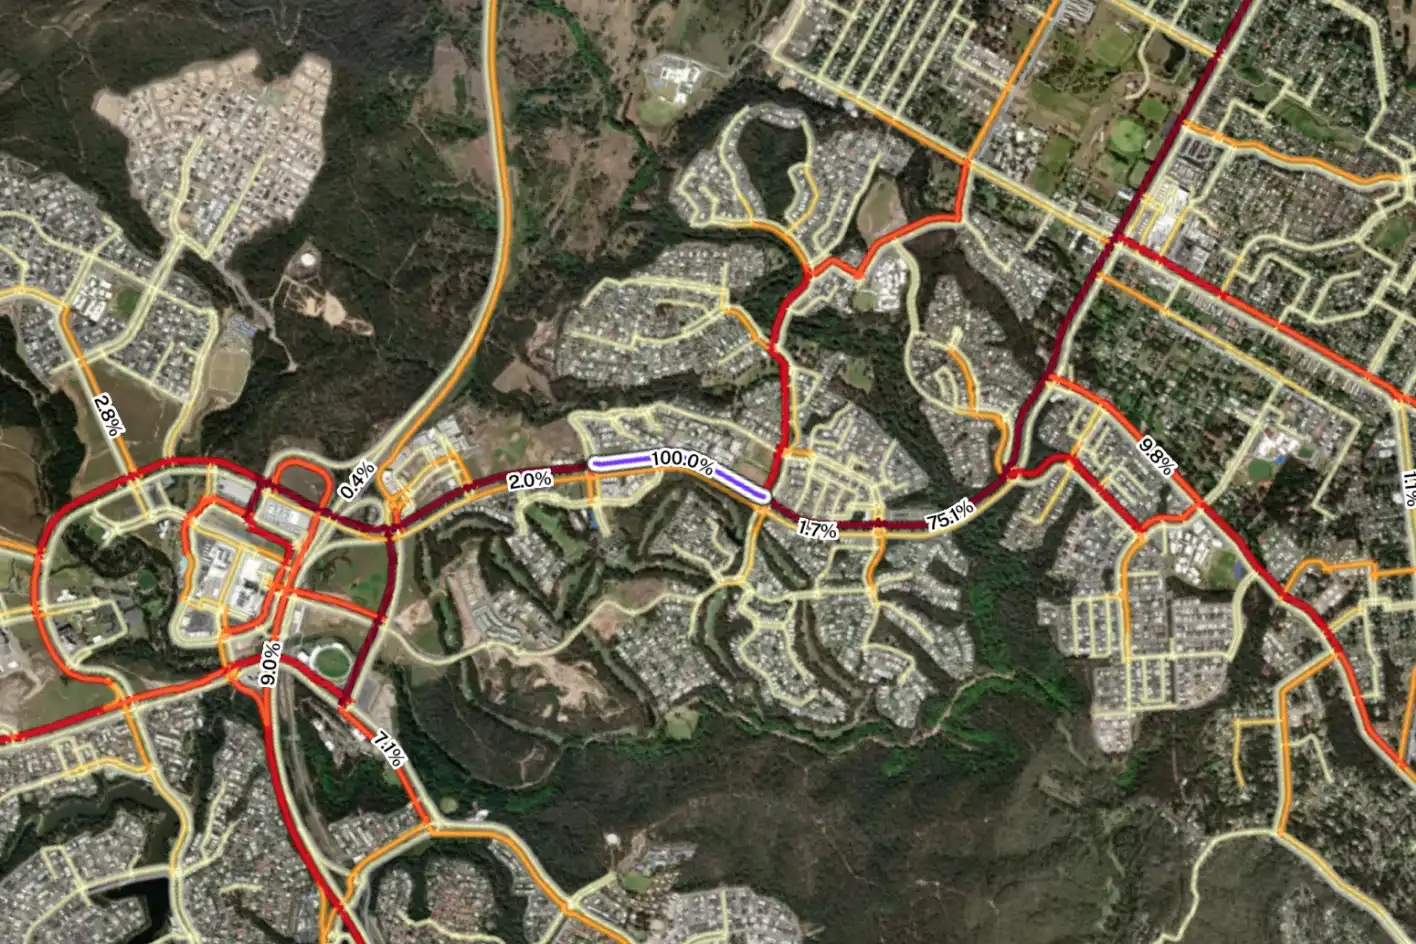
Foot Traffic Data
Get street-level insights on walk activity and pedestrian travel flows with Foot Traffic Data in Planwisely.
Make better business and planning decisions by seeing how people vote with their feet
Discover hidden patterns of movement and visitation
Evaluate, compare and benchmark locations using targeted high-intent travel data
Insights backed by data tested and validated by Australia’s leading travel modelling business
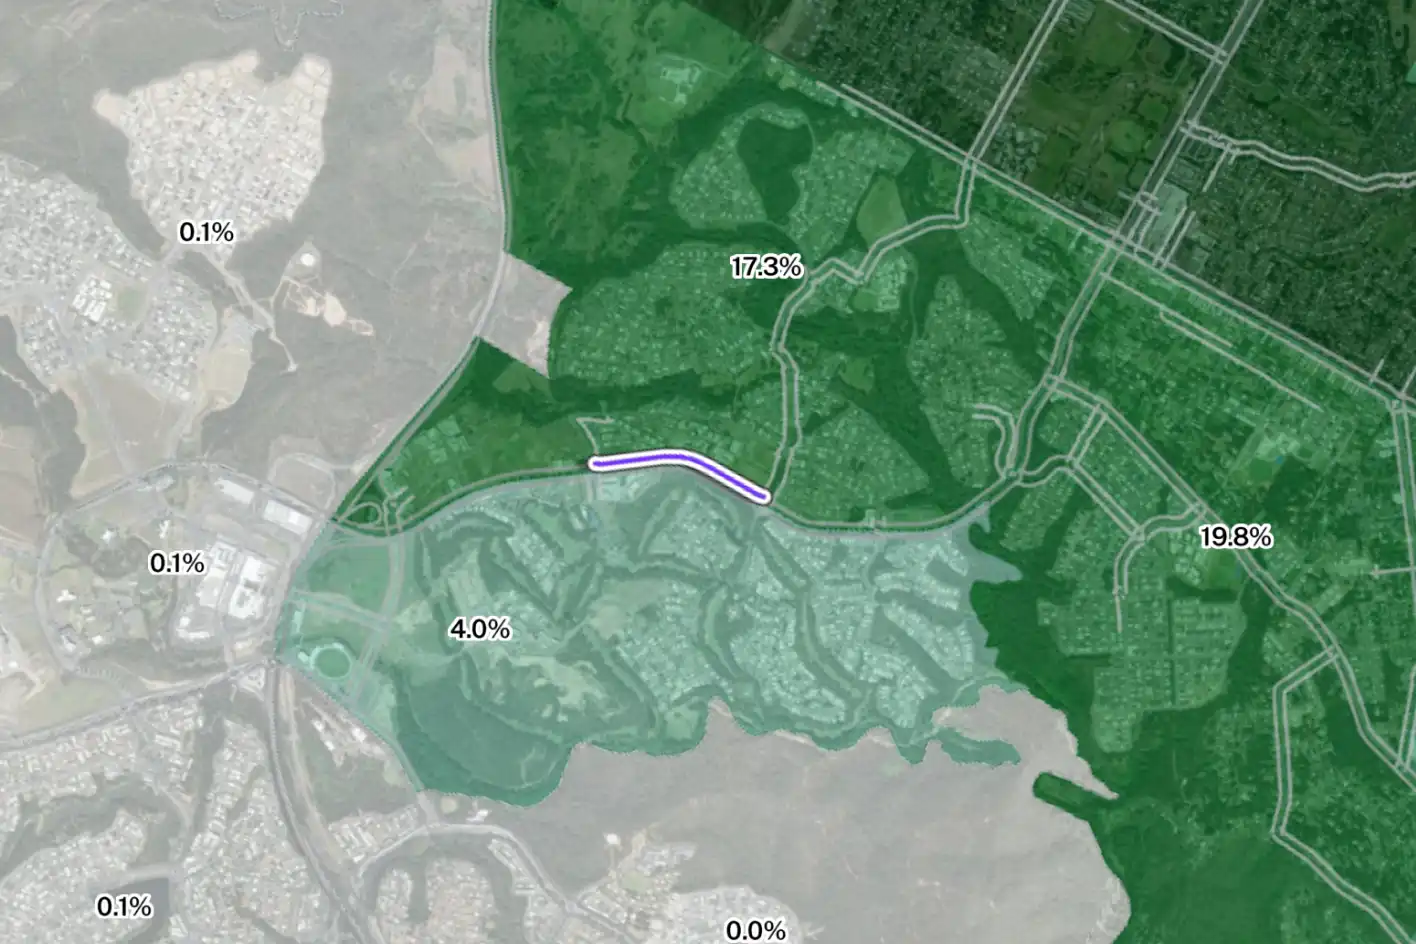
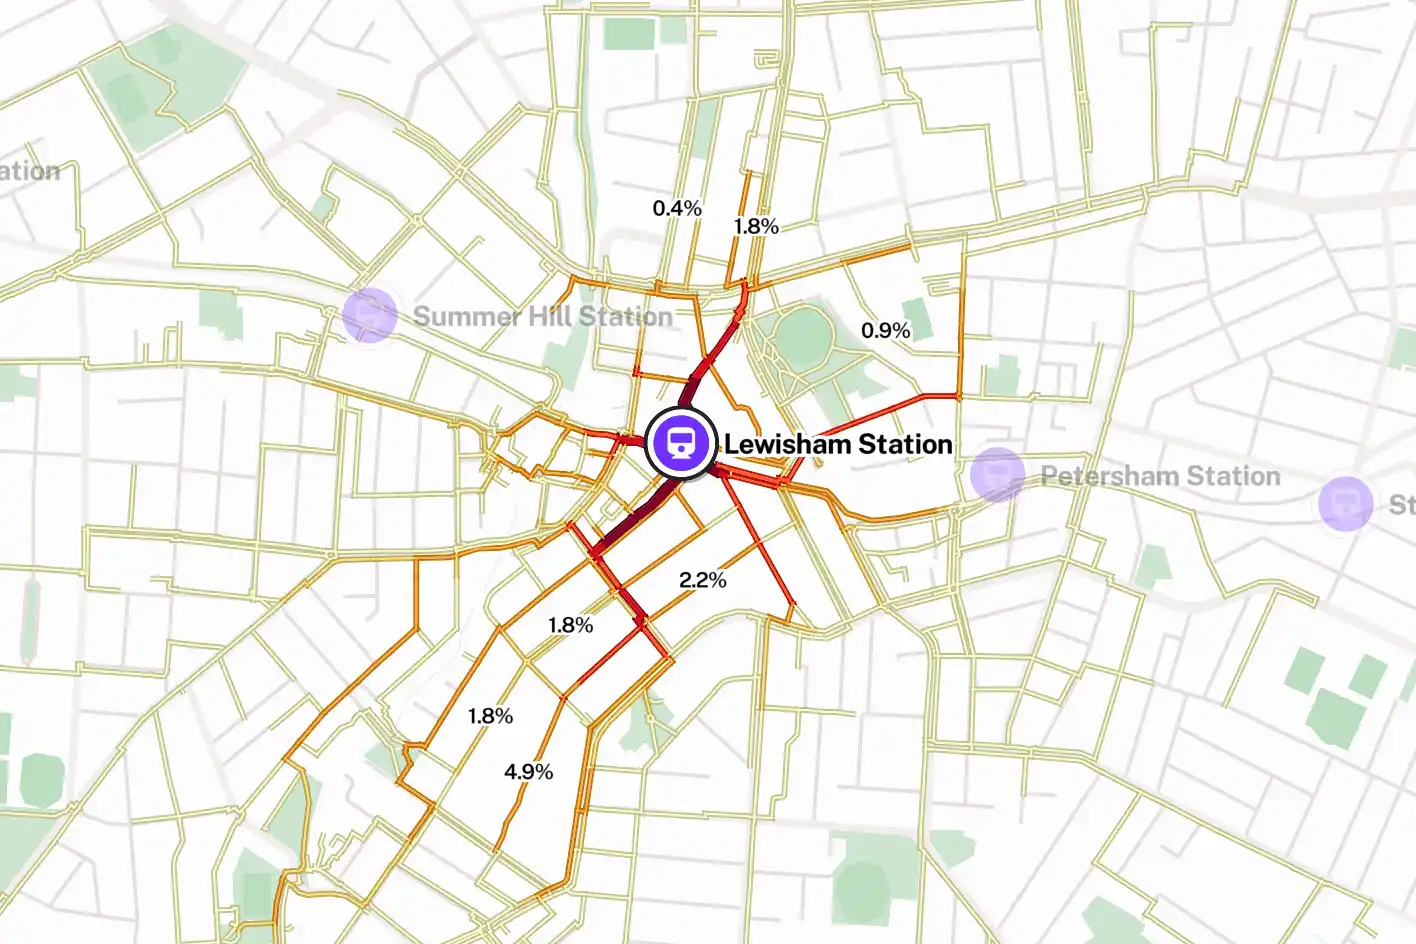
Station Catchment Data
Discover how people access train stations on foot and identify patterns of movement around them.
Discover the true walk catchment of a train station
Identify infrastructure gaps or deficiencies to guide investment
Analyse individual train stations or entire networks
Trusted by leading planners and decision makers


Want to get started with Planwisely?
Use powerful geospatial datasets to uncover insights, guide your decision-making process and deliver better outcomes for your project today.