6 trends that could shape walk and cycle planning in 2026

October 17, 2025

A national walk and cycle report has uncovered key active transport insights that could guide active transport planners in 2026 and beyond.

The recently-released 2025 CWANZ National Walking and Cycling Participation Survey, based on responses from over 12,000 Australians, offers a comprehensive view of how people are engaging with active transport across the country.

For councils and state-level active transport planning, the findings are a reality check and a roadmap – highlighting where momentum is building, where gaps remain, and what actions can unlock greater participation.

The 2025 CWANZ National Walking and Cycling Participation Survey has uncovered trends that planners need to monitor in 2026.

Here are six insights that matter most for shaping walkable, bikeable, and connected communities in 2026:

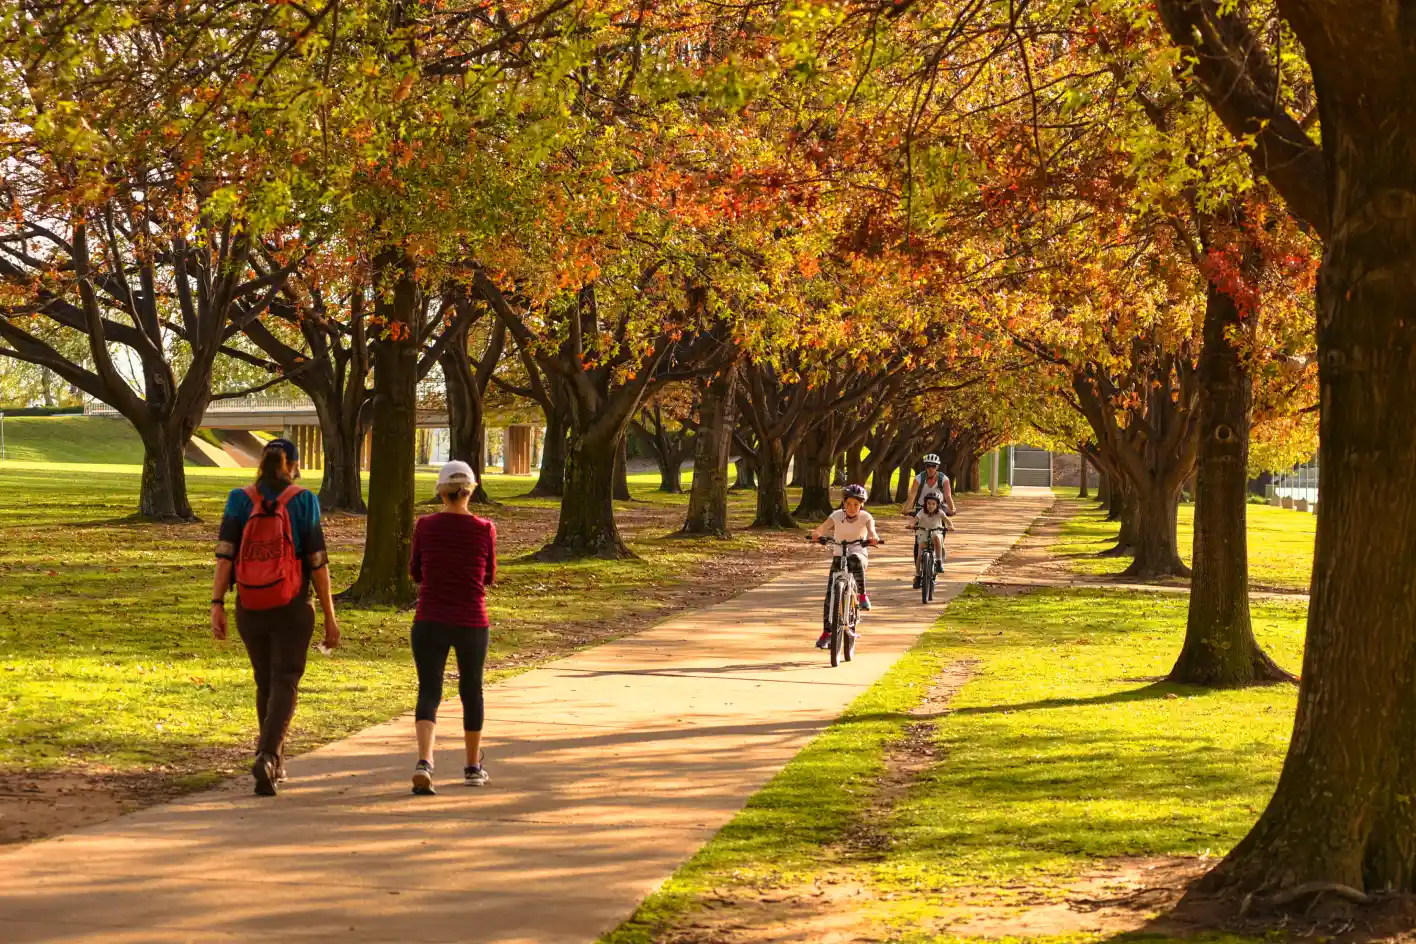
1. Walking is widespread (but slipping)

Walking remains the most common form of active transport in Australia, with 81% of people walking weekly for at least 10 minutes. But that’s down from 89% in 2023—a drop of over 1.9 million participants. The decline is most pronounced in regional areas and the Northern Territory.

Walking is still the most common form of active transport, but participation is notably down.

Interestingly, those who do walk are doing so more often, averaging 4.9 days per week (and many perceive themselves to be walking more than they actually are).

What this means: Councils should focus on retaining occasional walkers and reinvigorating participation through better footpath connectivity, shaded routes, and access to local destinations.

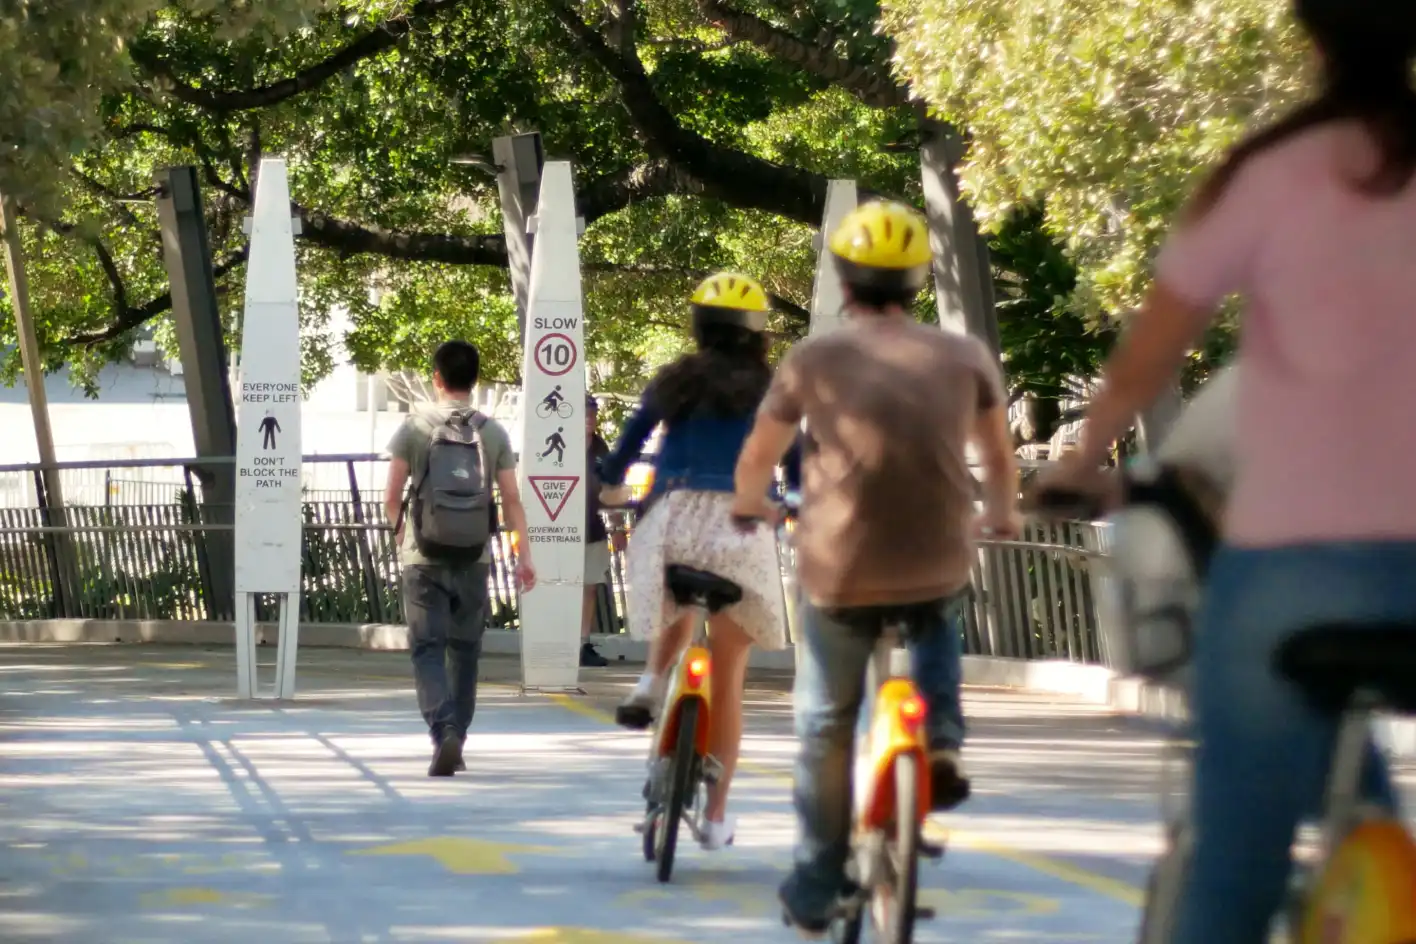
2. Cycling is a more viable transport mode

A major shift is underway: 43% of cyclists now ride for transport, up from 28% in 2023. This includes commuting, shopping, and connecting to public transport. While recreational cycling still dominates, the rise in utility cycling reflects changing priorities—driven by cost-of-living pressures, petrol prices, and improved infrastructure.

What this means: Councils should invest in direct, safe, and connected cycling routes that support everyday trips — not just weekend recreation (bike lanes to shops, schools, and transit hubs).

Base mapCycle trip volumesWalk trip volumes
It's possible to analyse walk and cycle volumes and run what-if analysis for active transport planning in Planwisely.

3. Infrastructure is the #1 lever

When asked what would help them walk or ride more, respondents overwhelmingly pointed to infrastructure. 42% cited better paths and safer on-road conditions, while 31% wanted secure bike parking. Other motivators included better connections to destinations and inclusive design for all ages and abilities.

More secure bike parking is a key infrastructure improvement that would encourage more people to cycle.

What this means: Infrastructure matters more than messaging. Prioritise safe crossings, protected lanes, end-of-trip facilities, and network connectivity. Confidence follows comfort.

Discover PATH: Active transport planning in Planwisely
Enquire now

4. ‘Interested but Concerned’ cyclists are a growth market

A new segmentation introduced in the 2025 survey revealed that 40% of Australians would cycle more if they felt safer or more confident. This group is especially prominent among women and younger adults and represents the biggest opportunity for mode shift.

What this means: Design for inclusive cycling: protected lanes, low-speed zones, and visibility improvements are key, while education and community programs could also help build confidence.

Designing for safer cycling paths could be crucial to encouraging cyclists who are on the fence.

5. Micromobility is emerging

While still niche, e-bike ownership has reached 6% and e-rideables (e-scooters, e-skateboards) are growing among younger males, especially in ACT and NT. These modes are ideal for short trips and first/last-mile connections, and their growth signals a broader shift toward flexible, low-cost mobility.

What this means: Councils should prepare for micromobility integration – including charging hubs, designated parking zones, and clear policy frameworks. These modes can complement public transport and reduce car dependency.

6. Urban youth are streets ahead

Children, teens, and metro residents show the highest active travel rates. For example, 37% of 5–9-year-olds cycle weekly, and ACT leads monthly cycling participation at 31%. These groups are already engaged—and represent the future of active transport.

The 5-9 age group is the most prolific for cycling in Australia.

What this means: Support safe routes to school, youth cycling programs, and family-friendly infrastructure could be crucial to increasing ridership in the future, because early engagement builds lifelong habits.

The 2025 CWANZ report confirms what many planners already know: infrastructure drives behaviour. But it also reveals new opportunities, especially in transport cycling, micromobility, and inclusive design. For councils and agencies, the challenge is clear: build for confidence, connect for convenience, and plan for diversity.

Discover walk and cycle planning in Planwisely with PATH
Get a demo

Want to get started with Planwisely?

Use powerful geospatial datasets to uncover insights, guide your decision-making process and deliver better outcomes for your project today.